Columns
Columns are used to make up Music Report Views (see How to change your report view). There are two types of columns: Song Attributes and Dynamic.
SONG ATTRIBUTE COLUMNS - Are made up of song related data. These include:
- Artist
- Artist & Title - A combination column ideal for wide report views.
- Category - The column to assign a new category to a song.
- Client Id - Music scheduling software Id that was provided at the time of survey processing.
- Id - Unique Airtime X Song Id.
- Previous Test Date - Last date the song was tested, not including the current selected survey.
- Previous Category - The category that was provided at the time of survey processing.
- Previous Rank - The numerical order of the songs in the last survey it was tested which is dictated by the sort order of a Dynamic Column.
- Rank - The numerical order of songs tested in the current survey as dictated by the sort order of a Dynamic Column.
- Rank & Previous Rank - A combination of Rank and Previous Rank columns, an ideal column for wide report views. This column is colour coded to give you a visual of a song's performance.
- Green arrow up signifies an increase in rank this survey compared to last.
- Red Arrow down signifies a decrease in rank.
- Grey line signifies no change in rank.
- Yellow star means that the song has never been tested or is not within the Momentum period (see below).
- If you hover over the rank a pop-up appears with information for the previous test date.
- Selected - A select box to aid in assigning a category to selected songs.
- Test Date - Displays the currently selected survey end date, or the last test date when used in a composite survey.
- Test Order - The order in which the songs were tested.
- Title
- Title & Artist - A combination column ideal for wide report views.
- Trends - Denoted by the graph icon, the trends column acts as a quick link to the Momentum page for that song.
- URL - As indicated by the play button, the URL column is a direct link to the audio which was tested in the survey. Click the play button to listen to the hook.
- Year
DYNAMIC COLUMNS - Provide a numerical or percentage result for a song when combined with a Filter. Each dynamic column can have either a Percentage or Raw result. These include:
- Raw (Highest score 100) - The unweighted average score of all people in the sample.
- Score (Highest score 175) - Indicates the overall listener passion for a song and are weighted in favour of more positive responses. Figures above 90 are strong and are important in making decisions about high rotating songs. For example, if a song has a strong Love score of 40–50%, expect to see the Score rise up close to 120 or even higher.
- Potential (Highest Score 175) - Includes the weighted average score of people who know the song. POTENTIAL indicates where the song might potentially end up. For example, if a song gets a Score of 65 but has a potential score of 85, it would suggest the song has “potential” to convert to a strong hit.
- Low Burn & High Burn - How tired your Members are of listening to a song. High burn includes those who said they were VERY Tired. Low Burn includes those who said they were LITTLE Tired. When High Burn gets to 25% you are potentially in dangerous territory, depending on format and target. You can see low burn convert to high burn progressively, based on the playing frequency. Consider that as a threshold for moving a song down but also factor in Score and Love into your decision.
- Love - Tells you the participants that rated the song 80+. If this percentage is 35 or more, people are loving it but remember to consider Score and Burn as well.
- Like - Tells you the participants that rated the song 60-79.
- Okay - Tells you the participants that rated the song 40-59.
- Dislike - Tells you the participants that rated the song 20-39.
- Hate - Tells you the participants that rated the song 1-19.
- Familiar - Tells you the of participants who know the song. While worth considering, it’s possibly the least important given the other criteria. Be cautious of songs under 85.
- Unfamiliar - Tells you the participants who rated the song 0, therefore, they don't know it.
- Positive - Tells you the participants who scored the song above 60 on the 1-100 scale (Love + Like).
- Negative - Tells you the participants who scored the song between 1-40 on the 1-100 scale (Hate + Dislike)
Column Rules
These are applied using the column header on the Music Report page. E.G. You wish to only view rows with scores above 100, type in 100 in the 'From' box, and select 'Apply'.
You can have multiple rules applied in the report view at one time. You can also apply text rules to the title and artist columns. E.G. You can search for ACDC and only see the results for their songs.
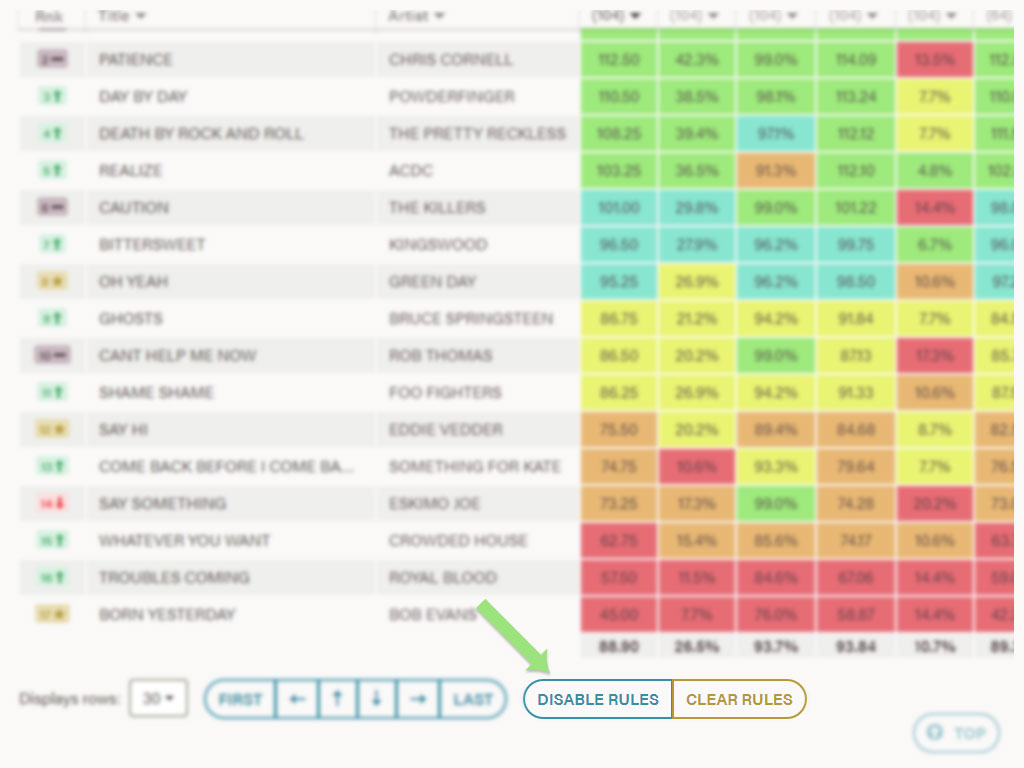
ENABLE RULES – When rules are applied to columns, this removes all rows that the rule does not apply.
DISABLE RULES – Apply when you want to see all rows but the rules are applied. The row outside the rule is greyed out.
CLEAR RULES – This will remove all rules in the report.
Completes
The total number of participants who completed the survey.
Momentum Period
Dictates how far back Airtime X needs to look when it includes historical data in a report. The Previous Rank and Rank & Previous Rank Combo column (see above) uses the momentum period. As well as the surveys listed on the Momentum page. The momentum period is customisable per station. The default momentum period is either the last 5 surveys or the last 90 days, whichever comes first. Surveys outside this period will not be included in some reports. If you would like to change your momentum period, contact SCAR Content Team or Xtra Insights.
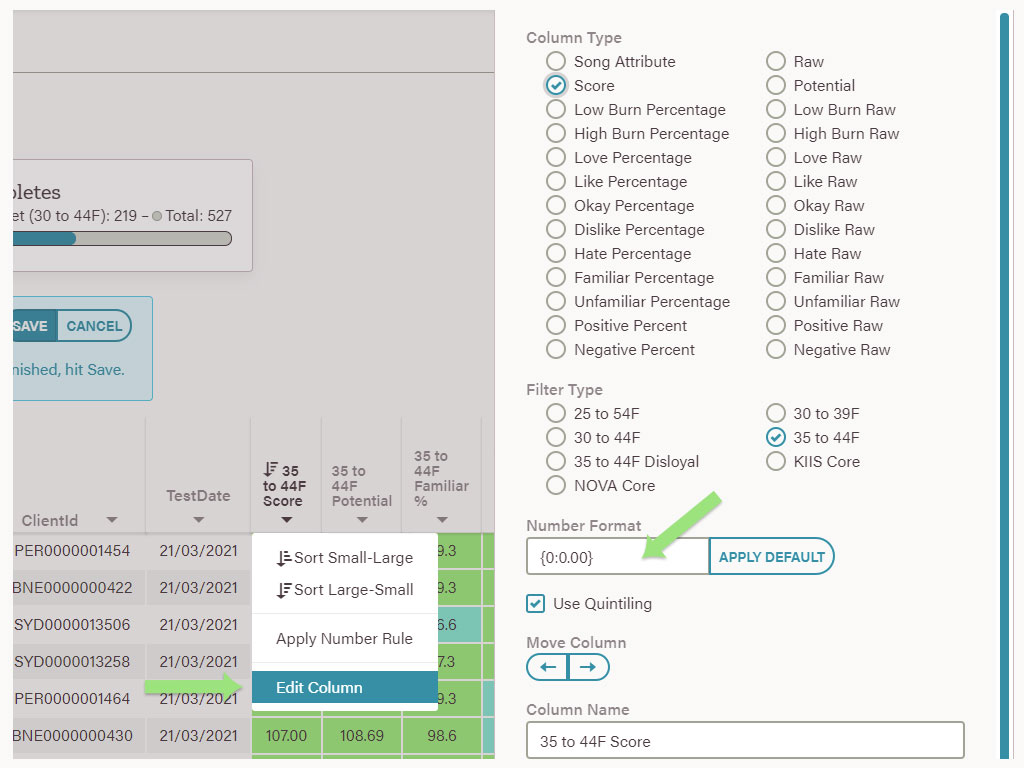
Number Format
You can customise the number format for each Dynamic Column in your Music Report View. By default Raw columns will display with two decimal places (117.23), and Percentage columns will display one decimal place with a percentage symbol (68.1%).
Change the number to your desired format by editing the column and the values in the Number Format text box.
Report Types
Normal – The default report type.
Mobile – Re-styles the Music Report page to fit on smaller devices. It's recommended to include only one Dynamic Type column (see Columns).
Category – Best used for assigning categories to Music Reports. It's recommended to enable at minimum: Selected, Previous Category and Category column types (see Columns).
Survey Types
AOS – Always On Survey (survey runs in the background of other survey formats)
MOMT – Mini Online Music Test (100 songs)
OMT – Online Music Test (400-600 songs)
WMR – Weekly Music Research (20-30 songs)
COMP – Composite Survey
- AVG - A composite survey using an average of results across all surveys. Average composite types are most commonly used for cross-market analysis and WMR surveys. Each song in the composite could have a different sample, depending on which surveys make up the composite.
- LAST - A composite survey which uses the results from the last survey a song was tested. Last test date composites types are most commonly used for single market analysis and MOMT surveys. Each song in the composite could have a different sample, depending on the last time it was tested.
Target
The main Filter used for a station which is used to generate key statistics.
Want to know more?
Check out the Airtime X Guide.